Global semiconductor sales forecast: Cowan's LRA model (based on Nov. 2009 sales data)
Here are the latest forecast results for 2009 and 2010 global semiconductor sales estimates associated with the forecasting model — the Cowan LRA model for predicting worldwide semiconductor sales.
The presently updated global semiconductor sales forecast estimates are based upon the recently published November 2009 actual sales numbers released by the WSTS (posted on its website on Jan 4, 2010).
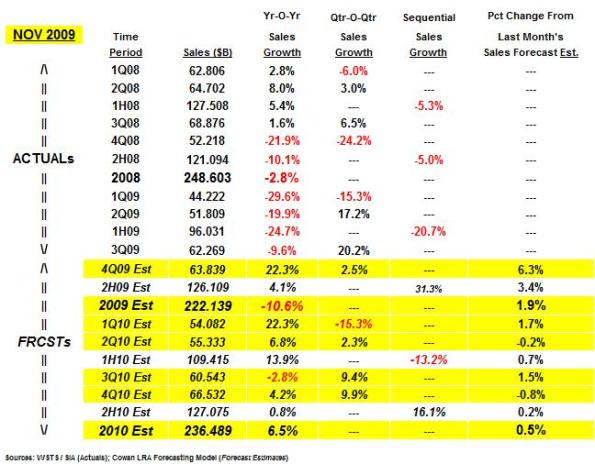
The table below details the latest, updated forecast numbers covering the next five quarters, that is, from 4Q09 through 4Q10, respectively, as well as for the full years of 2009 (including 4Q09) and 2010.
NOTE – This is the last forecast for 2009 since next month’s sales data from WSTS, namely for Dec 2009, will “wrap up” the year (2009 will become history!) and the model will “shift focus” to 2010 forecast expectations and beyond!
As the table below shows, the latest updates for years 2009 and 2010 chip sales forecast estimates increased by +1.9 percent and +0.5 percent, respectively, to $222.1 billion and $236.5 billion compared to last month’s sales forecast estimates of $217.9 billion and $234.0 billion, respectively.
The updated 2009 and 2010 chip sales forecast estimates correspond to yr-o-yr sales growth forecast estimates of -10.6 percent and +6.5 percent, respectively, which represent a continuing improvement compared to last month’s sales growth prediction of -12.6 percent for 2009 but, however, no change from last month’s same sales growth forecast estimate of +6.5 percent for 2010.
Additionally, the model also projects a sales forecast estimate for next month, namely for December 2009. Thus December’s (actual) sales forecast estimate is projected to be $20.023 billion, which corresponds to a 3MMA (three Month Moving Average) sales forecast estimate of $21.28 billion as is normally published by the SIA.
Watching the watchers
In addition to running the Cowan forecasting model each month, Mike Cowan also monitors and tracks the semiconductor sales growth prognostications of a wide range of other semiconductor industry watchers (including both WSTS and SIA bi-yearly forecasts), thereby tracking what each one of their respective predictions are for 2009’s sales growth (compared to 2008).
A table (as well as a distribution graphic) summarizes (and pictures) the 2009 sales growth forecast estimates for 22 other market researchers (besides myself). As shown in the aforementioned slides ongoing revisions for each of the market analysts 2009 sales growth estimates are listed along with the latest updates over the past month – only one (mine) during this reporting period – highlighted with (<== UPDATE).
As is evident from perusing the numbers for the group included in the tables and plotted in the histogram, the most update 2009 sales growth prediction range is a relatively broad distribution displaying a tri-modal “signature” hovering around declines of -20 percent (5 forecasters), -17 percent (2 forecasters) and -11 percent (14 forecasters), respectively.


