Archive
Top 5 high growth markets driving (semicon?) recovery, and top 10 hot and emerging technology platforms
Today, I received two wonderful reports — one, highlighting the top 5 high growth markets driving (semiconductor) recovery, and two, the top 10 hot and emerging technology platforms well poised to profoundly impact manifold sectors across the globe while offering potential high RoI for investors!
First, semiconductors! Semico Research has come up with a report that highlights the top 5 high growth segments driving growth and recovery in the semiconductor segment. For the record, 2009 is likely to see the global semiconductor industry decline by 12.5 percent. The top 5 segments according to Semico Research are:
* Netbooks
* Portable navigation devices (PNDs)
* Digital TVs
* DVD recorders
* Video game consoles
Hey, there really seems to be a lot of light at the end of the tunnel for the consumer electronics industry!
On netbooks, I think Intel needs to be given most, if not, all of the credit. Here’s what iSuppli has to say in its fast facts for Intel’s Q3 results:
* Intel also capitalized on the continued rise in demand for netbook PCs. The company dominates the netbook microprocessor market with its Atom chip. iSuppli predicts global netbook shipments will rise to 22.2 million units in 2009, up 68.5 percent from 13.2 million in 2008.
* While Atom represents only a small share of Intel’s total revenue, its profitability is disproportionately high. “Netbook microprocessors are a high-margin product because they utlilize old technology,” said Matthew Wilkins, principal analyst, compute platforms, for iSuppli. “The Atom is based on the old Pentium M microprocessor and uses a mature manufacturing process. Because of this, Intel is getting very high yields and an extremely high margin on the Atom.”
On PNDs, SatNav has recently introduced a Bluetooth enabled multifunction PND. Also, In-Stat reports that the worldwide unit shipments for PNDs will reach approximately 56 million units in 2012.
However, iSuppli has just sent out a story to me, saying that PNDs have now entered a period of slowing growth, spurring companies throughout the supply chain to re-evaluate their business models. Interesting!
As for digital TVs, according to DisplaySearch, developed markets are starting 2009 with strong growth and emerging markets are transitioning from CRT to LCD TVs faster than expected. However, plasma (PDP) TV is expected to fall about 2 percent Y/Y to 14.1 million in 2009 after strong 28 percent growth in 2008. As per iSuppli, OLED-TV revenue will likely rise by a factor of 240 by 2015—but still remain a niche. Let’s see!
DisplaySearch’s total global TV forecast is 200.4 million units in 2009, down 3 percent Y/Y, the first decline in total shipments in recent memory as the global recession and rising unemployment continue to take a toll on demand. However, the slowdown will be temporary as the worldwide economy emerges from recession and new markets enter the initial stages of the flat panel and digital TV transition.
Among DVDs, Samsung has introduced its first internal Blu-ray disc combo drive with BD-R and 8X BD-ROM read speed. Also, Flex-DVD is the latest technology in the DVD replication industry. This single layer format has the same capacity of a DVD-5 (4.7GB for standard size and 1.1GB for 3″ Mini DVD), but is half the thickness of the standard DVD.
Video game consoles — I find it quite interesting! It has been reported that the only products to see a decline in unit shipments in the second quarter were handheld video games, video game consoles, etc. Watch this market segment!
Now, to the top 10 hot and emerging technologies! According to a report from Frost & Sullivan, these are:
* Nanomaterials
* Flexible electronics
* Advanced batteries and energy storage
* Smart materials
* Green IT
* CIGS solar
* 3D integration
* Autonomous systems
* White biotech
* Lasers
Flex-DVD, above, is a great example of flexible electronics. Green IT — although a much abused term, it has certainly been on the top of the charts for quite some time now. Battery technologies and energy storage — yes, certainly. There are rightful places for CIGS solar — a point also made by Dr. Robert Castellano of The Information Network — and smart materials, as well as lasers and white biotech.
Well, what do you think folks? Do you agree with these top 5 and top 10 lists?
Indian semiconductor market to reach $7.59bn by 2010!
 Folks, here’s the full report on the India Semiconductor Association – Frost & Sullivan study on the Indian semiconductor industry. I’ve already provided my views on the Indian semiconductor industry report in an earlier post, for those who would like to know more.
First, the findings:
• The Total Semiconductor Market (TM) revenues poised to grow from $5.9 billion in 2008 to $7.59 billion in 2010. The market is estimated to grow at a CAGR of 13.4 percent.
• The corresponding period is likely to witness a CAGR of 13.1 percent in the Total Semiconductor Available Market (TAM). TAM revenues is anticipated to climb to $3.24 billion in 2010 from $2.53 in 2008.
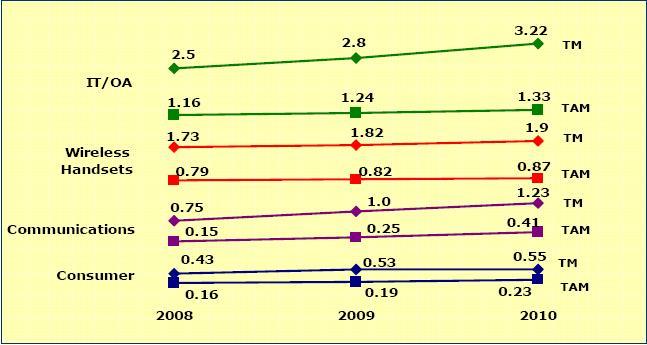 The following chart details how the Indian semiconductor industry is likely to shape up till 2010. All values are in US $ billion.
According to the study:
• Memory and MPU are the leaders in the TM and TAM revenues, respectively.
• IT/OA, wireless handsets and communications are the top three contributors to the TM revenues.
• IT/OA, wireless handsets and consumer are the mainstay of TAM revenue generation.
• Greater affordability of notebooks, netbooks, government IT initiatives, increased usage of memory cards to drive TM revenues from IT/OA. Ratio of desktops to notebooks reduces to 1:5
• Emphasis on rural mobile telephony and decline in handset pricesto drive demand; economically priced handsets in GSM and CDMA to witness higher growth. Mid priced handset segment, with enhanced features, to benefit.
• Rollout of 3G and WiMAX services to act as harbinger of associated infrastructure equipment TM. SDH 64 to increasingly replace SDH 4 and SDH 16. Increased manufacturing expected to favor TAM revenues.
• Evolving lifestyle expected to assist consumer electronics related semiconductor TM. DTH revolution creates demand for STB like never before. The market is expected to sustain as technology upgrades from MPEG2 to MPEG4.
• Projects like national ID cards, bank cards and kisan cards are likely to favor the semiconductor usage in emerging segment of smart cards.
• Low manufacturing index leads to opportunity loss of $3.37 billion semiconductor market revenues. This loss anticipated to increase to $4.35 billion by 2010.
• Immense, yet untapped, opportunities exist for semiconductors in STBs, LCD TVs, digital cameras and storage Flash memory markets.
• Decline in semiconductor product prices result in lower revenue realization; key semiconductor products impacted are memory, MCU and discrete. Increase in memory usage in a variety of products to offset revenue loss on accountof decline in prices.
• Increased usage of system-on-chip (SoC) leads to decline in the overall revenues. Though the decline is not proportionate to the reduction of components, the impact is significant.
• Higher penetration of notebooks to impact market for desktops and offline UPS
• Current slowdown to impact overall growth and manufacturing investment prospects for 2009; uncertainty in government decision-making adversely affects growth.
Some of the other forecasts of the report indicate that India will likely improve its share to 2.8 percent of the global semiconductor market by 2010. Also, the India market CAGR forecast is at 6.4 times the global market CAGR, over next two years !
Again, do not get carried away by these statistics!
Further, in an update to the 2007 forecast, the previous study had non-inclusion of select products segments such as digital cameras, power supplies, CFL, CCTV, PoS, Weighing Scale, etc., which have been now added. This update sees the entry of new players and an unprecedented expansion of the DTH market. Migration of select products manufacturing outside the country has also taken place.
The total TM and TAM revenue constituents (2008) are: TM revenues: $5,901.8 million; and TAM revenues: $2,531.8 million. Now, for the segment wise break-ups and segment drivers, respectively.
IT/OA semiconductor constituents (2008)
TM revenues: $2,503.4 million; TAM revenues: $1,161.3 million.
* Notebooks, desktops and servers were the key contributors to the MPU, memory and ASSP TM revenues.
* Desktops are key revenue generators for MPU TAM revenues.
* CAGR for IT/OA is TM at 13.5 percent and TAM at 7.4 percent for 2008-10.
* Key drivers for TM are government IT initiatives, low priced notebooks, netbooks and storage flash memory; while low priced desktops and LCD monitors are the drivers for TAM.
Wireless handsets semiconductor constituents (2008)
TM revenues: $1,738.3 million; TAM revenues: $791 million.
* DSP and ASSP to ride on growth of economically priced handsets in GSM and CDMA.
* Smartphones in GSM to drive growth of TM revenues for memory, DSP and ASSP.
* CAGR for wireless handsets is TM at 5.7 percent and TAM at 5.1 percent for 2008-10.
* Key drivers for TM and TAM include GSM handsets priced <$125 and between $125-250, as well as CDMA handsets priced $250 is the key driver.
Communications semiconductor constituents (2008)
TM revenues: $754 million; TAM Revenues: $153.9 million.
* WiMAX BTS is the driver for ASIC market.
* Infrastructure equipment like WiMAX and STM were the key factors behind analog power’s TM and TAM revenues.
* Logic/FPGA rode on the STM and BTS markets.
* Low manufacturing index conspicuous in this key segment.
* CAGR for communications is TM at 27.9 percent and TAM at 64.1 percent for 2008-10.
* Key drivers for TM and TAM include the rollout of 3G, WiMAX and penetration of broadband services. For TAM, BTS, STM and WiMAX are the major drivers.
Consumer semiconductor constituents (2008)
TM revenues: $432.9 million; TAM revenues: $165.6 million.
* ASSP market growth on account of penetration of LCD into CRT TVs, STBs and DVD players.
* Low manufacturing index indicates lost opportunity for semiconductor revenues.
* CAGR for consumer equipment is TM at 12.2 percent and TAM at 18.7 percent for 2008-10.
* Key drivers for TM include STBs, LCD TVs and digital cameras, while those for TAM include STBs, LCD TVs and water purifiers.
Industrial semiconductor constituents (2008)
TM revenues: $144.9 million; TAM revenues: $106.7 million.
* Energy meters, UPS and weighing scales are the contributors to the MCUs.
* Discrete and analog power are omnipresent products across applications.
* CAGR for industrial electronics segment is TM at 12.5 percent and TAM at 14.9 percent for the period 2008-10.
* Key drivers for TM include online UPS, CFL, energy meters and power supplies. Those for TAM include energy meters, CFL and power supplies.
Automotive semiconductor constituents (2008)
TM revenues: $76.5 million; TAM revenues: $50.8 million.
* The MCU market has high dependence on the EMS and body electronics markets
* The Nano car, statutory regulations on emission norms, and safety features are likely to sustain demand.
* CAGR for automotive electronics is TM at 23.1 percent and TAM a
t 24.8 percent.
* Key drivers include two-wheeler instrument clusters, EMS and immobilizers.
Other electronics semiconductor constituents (2008)
TM revenues: $251.7 million; TAM revenues: $102.5 million.
* Applications like smart cards, and aerospace and defence are driving the ASSP TM and TAM revenues, respectively.
* CAGR for this segment is TM at 16.8 percent and TAM at 23.8 percent.
* Smart cards and government space research programs are the key drivers.
Indian semiconductor market growing thrice as fast as global market
As per the India Semiconductor Association (ISA) and Frost & Sullivan (ISA-F&S), India’s 2007 annual growth in the semiconductor market is nearly triple the rate at which the global semiconductor market is currently expanding.
The actual total market (TM) was $2.69bn and total available market (TAM) was $1.26bn. By 2009, the TM will likely grow at a CAGR of 26.7 percent to $5.49bn and the TAM will grow at a CAGR of 36 percent to $3.18bn.
Anand Rangachary, managing director, South Asia & Middle East, Frost & Sullivan, said: “The global semiconductor total market is growing at a rate of 8-9 percent CAGR, whereas the India total market is growing at 26.7 percent CAGR till 2009. India, which represented 1.09 percent of the global semiconductor market in 2006 will be 1.62 percent by 2009. As domestic demand for all electronics products is growing India is emerging as one of the fastest growing region in the world.”
India is one of the fastest growing regions in the world. TAM growth rate at CAGR 36 percent, compared to 26.7 percent of TM CAGR signifies higher growth in local manufacturing of electronics products. In the industry, the technology change is so dynamic that every year, a new application/product gets launched, which changes the demand forecast by many ways (eg. launch of iPOD or iPhone/ WiMAX/GPON/LCD TV) as well as ASP changes.
The government rules change demand, and therefore ISA captures these changes on a real-time basis. Hence, ISA decided to have an annual update of the India market report. All of these changes are well captured in the current report and India’s growth looks almost three times compared to the global growth rate.
According to the report, the top five end-user products that are likely to drive growth are mobile handsets, desktops and notebooks, GSM base stations, set-top boxes and energy meters. Microprocessors, analog, memory and discretes are said to be the top four semiconductor products likely to drive revenues.
While these stats read great, I am wondering exactly how much of these handsets will be made in India. Rather, what percent of silicon going into these handsets will be made in India! Memory is said to be a driver of the revenue. Well, the DRAM market has been acting up.
Now, iSuppli reported in a recent report:
“Following a brief respite, market conditions for DRAM suppliers are set to take a turn for the worse in September, iSuppli Corp. predicts.
iSuppli previously forecasted that DRAM prices would undergo a downward correction in October, following the current period of relative strength that brought an end to a phase of severe erosion in the second quarter. However, iSuppli now believes the DRAM prices will begin to decline one month earlier, in September.
Near-term market conditions remain in a state of flux with a great deal of uncertainty in the supply chain as suppliers and distributors continue to work off a glut of DRAM inventory. Furthermore, sales momentum is waning in the DRAM spot market, as rising prices and falling supply of LCD panels cut into the available budget for memory in some PCs.
This is bad news for memory suppliers, which had been basking in the present period of relative pricing strength. Weak pricing in September will set the stage for further erosion in the fourth quarter. iSuppli now foresees the possibility of double-digit sequential price declines in the fourth quarter, erasing any increases that aided suppliers in the third quarter. Because of this, DRAM suppliers’ profitability will dwindle in the fourth quarter compared to the third, iSuppli predicts.”
I’d be very interested to see how much of these memory predictions turn out to be correct! If they aren’t, I wonder how memory is going to figure among the top four revenue drivers in the Indian semicon market, at least in the near and immediate future. Unless, I somehow missed a point somewhere!!
