Archive
Reliving 9/11! I am numbed!!
May 1/2 marks a great day in the democratic history of the world, and especially of America! The US forces killed wanted terrorist, Osama Bin Laden, the man behind the 9/11 bombings in New York, in Abbottabad, Pakistan.
Paul, Micheal, Ian, Swee Heng, did you all hear that?? How do you feel about it?
I am numbed! Don’t know how to react!! All I remember is that fateful evening of September 11, 2001! Back then, I was Editor, Wireless Week, Asian Edition, which was later shut down. I had just returned from work in Singapore, and switched on the TV set, while having dinner. As usual, I had browsed to CNN to see what’s happening worldwide. Suddenly, around 9.30pm, Singapore time, there was a news flash — the Twin Towers had been hit by planes!
What followed thereafter is something that one can only imagine to witness in a movie hall!
Here’s what Wikipedia says about the event: “On September 11, 2001, terrorists hijacked American Airlines Flight 11 and crashed it into the northern facade of the north tower at 08:46, impacting between the 93rd and 99th floors. Seventeen minutes later, a second team of terrorists crashed the similarly hijacked United Airlines Flight 175 into the south tower, impacting between the 77th and 85th floors.”
The next morning, I went to the office, only to be greeted by a memo, and more tragic news, that two of our colleagues were in one of the planes, probably, American Airlines Flight 11, that had crashed into the Twin Towers. The other plane that crashed into the Twin Towers was the United Airlines Flight 175. My colleagues were en route to attend the Wireless Show, to be held in Las Vegas! Little did they know that their lives would end so tragically!
Post 9/11, Reed Elsevier called off its plans for Asia, as I, and several others, were laid off!
Most of the gentlemen, whom I have named in this blog, were also asked to leave, although a bit later!
Today, the wheel seems to have turned full circle!
Clearly, mixed signals in OEM semiconductor design activities!
Friends, here is the full report on iSuppli’s recent activity titled “Mixed Signals in OEM Design Activities”.
Min-Sun Moon, senior analyst, Semiconductor Spend and Design, iSuppli, discussed how the “values” of design activities are discerned globally and how design decisions are made by a given country.
This report should be of particular interest to the Indian semiconductor design industry as it is apparent there is considerable scope for growth and development.
It is very well documented that everyone has been hit hard by the economic downturn. The electronic OEMs are no exception. They have also reduced shipments. The average selling prices (ASPs) of semiconductor devices have dropped dramatically as well.
Top six design influencing countries
As per iSuppli’s Design Activity Tool, the top six countries leading in the design influence are as follow: USA, Japan, China/Hong Kong, Taiwan, South Korea and Germany. The United States retains the no. 1 position, followed by Japan and China.
The dramatic changes in ASPs of chips and products meant an almost about 5 percent drop in semiconductor spend in 2008, and above 21 percent drop in semiconductor spend by the top OEMs in 2009. Hence, design activities by top OEMs dropped significantly.
The USA apparently has been going through a tough period, and it does not seem to have a bright future in 2009-10 due to drop in design spends. However, in 2010, it should post about 9-10 percent growth. The top design influencers in the USA include HP, Dell, Apple and Motorola.
China seizes opportunity
According to Moon, Japan retained the second position. However, China has seized the opportunity during the recession. It has some growth compared to other countries who have had negative growth this year.
China still remains one of the most attractive markets for OEMs to enter. Many top OEM have either opened or expanded R&D centers in China in the last few years.
However, because of the recession, the expansion by OEMs slowed down in China during 2009. Nevertheless, the Chinese market continues to grow. In the next few years, China will grow and the other countries will have some positive growth as well, but their growth will be slower than that of China.
China has also been showing interesting signs. Some Chinese companies are trying to enter new markets, such as automotive.
China is currently the third largest country in terms of design influence. The design share is about 10 percent in 2009. China could get close to Japan and the USA, but it will not happen in the near future though.
Top five countries in 2009
In 2009, the top five countries by design influence spend share are as follows: USA — 31 percent, Japan — 25 percent, China/Hong Kong — 10 percent, Taiwan — 8 percent, South Korea — 7 percent, and the Rest of the World — 19 percent.
Mixed signals are apparent in the design activities by country. For instance, this year, the USA has been losing market share. A large percent of design activities are moving to the Asia Pacific region. Some business in the USA is being continued or reduced — and being moved to other regions — in order to maintain the business and lower the cost of operations.
Japan’s design spend share increased from 22 percent (approximately $40 bn in 2008) to 25 percent in 2009. Japan is bringing a lot of design activities back home.
Taiwan used to be third largest in the design influence, but has now dropped to the fourth position, with share in design spend reaching 8 percent in 2009. China also contributed to the changes here. However, it is still better than others as some OEMs are still outsourcing to some ODMs located in Taiwan.
Identifying targets by regions
iSuppli gave examples of designing with sensors and actuators, and LEDs, as these are very popular currently.
According to Moon, designs using sensors and actuators have been more than 30 percent in the USA, while Japan has more than 25 percent. It is over 20 percent in Europe, while such designs have been less in Asia Pacific — above 15 percent.
The biggest influencers for sensors and actuators in the USA are said to be Apple, HP and TRW Automotive.
For LEDs, more use has been happening in Japan — over 30 percent. As an example, there are more LED TV design activities in Japan. The biggest influencers for LEDs in Japan are Canon and Sony.
Changes due to M&A
Another trend visible in the design spend share has been the changes due to mergers and acquisitions.
As an example, we have the Mitac Group, which acquired Magellan’s consumer products division. In 2008, Mitac Group had 78 percent spend in Taiwan, and 18 percent in the USA. After acquiring Magellan, Taiwan’s design spend share became 57 percent and USA’s became 13 percent. On the other hand, France’s share grew to 17 percent and Russia’s to 7 percent. This indicates that country-wise, budgets do get changed. This is just one example.
These are indeed very interesting numbers and facts, and as mentioned earlier, India has a considerable opportunity as an influencer in the semiconductor design spend going forward.
Will solar downturn lead to more mature PV industry?
The severe downturn in the global Photovoltaic (PV) market in 2009 actually could have a positive outcome for the worldwide solar industry, yielding a more mature and orderly supply chain when growth returns, according to iSuppli Corp.
Worldwide installations of PV systems will decline to 3.5 Gigawatts (GW) in 2009, down 32 percent from 5.2GW in 2008. With the average price per solar watt declining by 12 percent in 2009, global revenue generated by PV system installations will plunge by 40.2 percent to $18.2 billion, down from $30.5 billion in 2008.
The figures present iSuppli’s forecasts of global PV installations in terms of gigawatts and revenue.
Fig 1: Global Photovoltaic System Installation Forecast in Megawatts, 2008-2013 Source: iSuppli, April 2009
“For years, the PV industry enjoyed vigorous double-digit annual growth in the 40 percent range, spurring a wild-west mentality among market participants,” said Dr. Henning Wicht, senior director and principal analyst for iSuppli. “An ever-rising flood of market participants attempted to capitalize on this growth, all hoping to claim a 10 percent share of market revenue by throwing more production capacity into the market. This overproduction situation, along with a decline in demand, will lead to the sharp, unprecedented fall in PV industry revenue in 2009.”
However, the 2009 PV downturn, like the PC shakeout of the mid 1980s, is likely to change the current market paradigm, cutting down on industry excesses and leading to a more mature market in 2010 and beyond.
Fig 2: Global Revenues Generated by Photovoltaic Installations 2008-2013 in Millions of US Dollars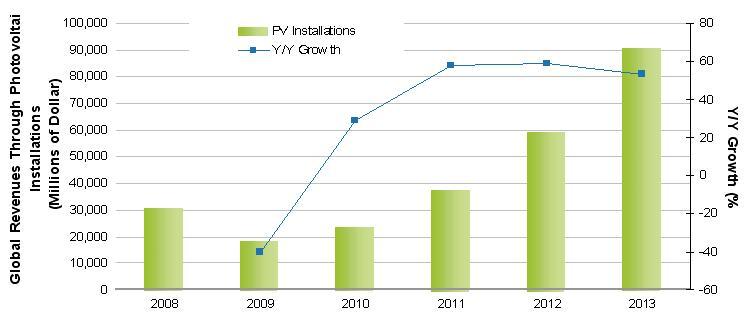 Source: iSuppli, April 2009
“The number of new suppliers entering and competing in the PV supply chain will decelerate and the rate of new capacity additions will slow, bringing a better balance between supply and demand in the future,” Wicht said.
Blame it on Spain
The single event most responsible for the 2009 PV market slowdown was a sharp decline in expected PV installations in Spain. Spain accounted for 50 percent of worldwide installations in 2008. An artificial demand surge had been created in Spain as the time approached when the country’s feed-in-tariff rate was set to drop and a new cap of 500 Megawatts (MW) loomed for projects qualifying for the above-market tariff. This set a well-defined deadline for growth in the Spanish market in 2009 and 2010.
While the Spanish situation is spurring a surge in excess inventory and falling prices for solar cells and systems, this will not stimulate sufficient demand to compensate for the lost sales in 2009. Even new and upgraded incentives for solar installations from nations including the United States and Japan—and attractive investment conditions in France, Italy, the Czech Republic, Greece and other countries—cannot compensate for the Spanish whiplash in 2009.
The Spanish impact will continue into 2010, restraining global revenue growth to 29.2 percent for the year. Beyond Spain, the PV market is being adversely impacted by the credit crunch.
“Power production investors and commercial entities are at least partially dependent upon debt financing,” Wicht noted. “Starting in the first quarter of 2009, many large and medium solar-installation projects went on hold as they awaited a thaw in bank credit flows.”
After the fall
After 2010, the fundamental drivers of PV demand will reassert themselves, bringing a 57.8 percent increase in revenue in 2011 and similar growth rates in 2012 and 2013.
“PV remains attractive because it continues to demonstrate a favorable Return on Investment (RoI),” Wicht said. “Furthermore, government incentives in the form of above-market feed-in-tariffs and tax breaks will remain in place, making the RoI equations viable through 2012. Cost reductions will lead to attractive RoI and payback periods even without governmental help after 2012.”
Furthermore, lower system prices will open up new markets by lowering incentives and subvention costs. The lower the PV system prices are, the lower the incentives will have to be. Developing regions will be big the beneficiaries of these lower prices and thus will grow faster than the global average, Wicht said.
Source: iSuppli, USA
