Archive
Thrive or survive…going for gold in post-recession recovery: Malcolm Penn @ IEF2010, Dresden

Malcom Penn, chairman and CEO, Future Horizons.
According to Malcom Penn, chairman and CEO, Future Horizons, 2010 — a barnstroming year — will likely see the global semiconductor industry grow by 31+ percent. He was delivering the company’s forecast at the ongoing 19th International Electronics Forum (IEF) 2010 in Dresden, Germany, which ends here tomorrow. He said it would take a disaster of the scale of Lehmann Brothers to derail this now!
Some of the other forecasts made by Malcolm Penn include:
* 2011: +28 percent; based on: peak of the structural cyclical boom (could stretch into 2012).
* 2012: +18 percent; based on: normal cyclical trash cycle starting 2H-2012 (1H-2013?).
* 2013: +3 percent based on: market correction in full flow (could be negative, cap ex overspend and inventory build depending).
* 2014: +12 percent; based on: start of the next cyclical recovery (single digit, if 2013 is negative).
The forecast track record of Future Horizons is quite interesting. As per forecasts made during the IFS2010 in Jan.2010, the chip fundamentals was said to be in very good shape. The industry was starting its recovery with shortages. Also, the ASPs had already stopped faling. The inventory levels were at an all-tme low. Finally, the capacity was tight, and spending, weak!
All of this added up to two years of very strong growth in prospect. Penn had said: “It doesn’t get much better than this. But, despite what the numbers say, still no-one believes beyond the next quarter! “Ah but” is still driving the industry consensus!
Industry fundamentals don’t lie — believe in them or die! The capacity famine was instigated two+ years ago — well before the crasj, today’s shortage was inevitable. The recovery dynamics will continue to strengthen. Future Horizons’ forecast is now +31 percent ~$300 billion. The next trash dynamic has still not yet triggered. It is unlikely to happen before 2011, meaning, 2012 impact. However, the economic uncertainty remains the biggest risk. Also, the global financial system is fundamentally flawed. Read more…
Some thoughts on VLSI manufacturing in India
VLSI manufacturing: The government of India has to give appropriate incentives to this industry and suitably phase these to allow an ecosystem to build up. The fabless model is fine for companies to transact their business. But, India needs to have this technology or some semblance of it to start with or else it would never be able to count herself amongst the leading nations of the world. How can we achieve that?
a) One of the quickest ways to get started is to create an organization (with equity wholly or partly owned by the government of India) with the charter that that company invest in/fractionally own some of the leading semiconductor manufacturing facilities in Taiwan. TSMC may be very difficult to own even modest percentages, but simultaneously buying reasonable stakes in UMC, Chartered Semiconductor, the IBM multi-platform consortium may be possible with (my guess) at under $1 billion that gives adequate leverage. This organization then makes available fab capacity (that is available to them now due to their fractional ownership) to fabless product companies with intended product sales in India.
b) Repeat the above for packaging, assembly, and VLSI test operations. (The challenges are less here though, but these are just as important elements of the ecosystem).
c) With this, India will “own” leading edge VLSI technology although in a circuitous manner, but given that we missed the boat by over 20 years I think this is a reasonably low cost but effective way to get a starting foothold.
d) Next, and in parallel, the government ought to give incentives to companies to create semiconductor manufacturing capacities on Indian soil but buying re-furbished and lower cost equipment at previous generation technology nodes.
Some policies are required here that allow easy transport back-and-forth of sub-assemblies for repair and replacement.
e) Eventually, the organization(s) in (d) above will “catch” up with those in (a) above. There will need to be phased modification of the incentives, reducing some, changing some such that over a six-seven year period all incentives can go away and the eco-system will be self sustaining.
f) Well, not quite, we will also need to address (i) the semiconductor manufacturing, assembly, test equipment manufacturing and (ii) the semiconductor manufacturing raw materials (silicon wafers, silicon grade pure chemicals, etc etc). The focus to these technologies have to be phased to the decade after the steps outlined in (a) to (d) have yielded some measurable results.
Friends, please feel free to share your thoughts, comments, etc., and add value.
Global semicon industry update Mar. '10: Time for a reality check…pessimism has swung too far, says Future Horizons
The real significance of January is its potential impact on first quarter sales. Were this run rate to continue through February and March, first quarter sales would be up 8 percent versus Q4-09. That would make 2010 grow a staggering 40 percent on 2009. This is by no means a forecast but it does serve to illustrate the strength of the recovery from the abyss this time last year.
Ignoring the structurally (and typically) wild individual monthly fluctuations – which simply means no single month is a good indicator of the underlying trends – the month on month numbers will not settle down until the second quarter of 2010. That being said, given the likely strength of the first quarter versus Q4-09, our current 22 percent forecast for the total year now looks far too low.
Our 22 percent forecast for 2010 was based on the relatively benign quarterly growth pattern of -1.0, +1.0, +6.2 +2.0 percent; in essence a very weak year. No one we speak with is seeing a negative first quarter, with a consensus now building for at least 3 percent positive growth. That alone would bring the year on year growth up to 28 percent.
At the same time, almost everyone is also boasting a strong Q2 backlog with price stabilisation, even increasing; low inventory levels; and tightening supplies, which places severe doubt on the credibility of our plus 1 percent second quarter growth forecast. Were this to be say plus 3 percent, the year on year growth would be 30 percent.
It does however give us further confidence in our analysis and now places our forecast at the low end of the forecast range. Barring an epic 9/11, Act Of God or immoral banker style disaster, growth of anything less than 22 percent in 2010 is now all but impossible.
We fully expect to be increasing our forecast to around the plus 30 percent level at our forthcoming IEF2010 International Electronics Forum in Dresden, May 5-7 bringing the 2010 market within spitting distance of $300 billion in revenues. Read more…
Chip market outlook: Back to normal abnormality? — Malcolm Penn @ IEF2009, Geneva

Malcolm Penn, Chairman & CEO, Future Horizons.
Future Horizons has revised its 2009 global semiconductor industry forecast to -14 percent growth (+/- 2 percentage points). This was revealed by Malcolm Penn, Chairman & CEO, Future Horizons, while delivering the company’s forecast at the ongoing 18th International Electronics Forum (IEF) 2009 in Geneva, Switzerland, which ends here tomorrow. “He said, “It’s all about good management … only the bad times tell!”
Some of Penn’s other forecast summaries include:
* Economic recovery is said to have already started from 2H-2009.
* Further ‘50 percent’ cap ex reduction.
* Memory price recovery 2H-2009.
* Still lots Of blood on the road near-term
* Strong will get stronger as weak go to the wall.
* Watch for tight capacity starting 2H-2009.
* Crisis is the time to implement change (brings out the best and worst).
* R&D/new products/sound marketing will win (not counting pencils and scrapping the free coffee).
Outlook for 2010 and beyond
Penn also presented the company’s outlook for the global semiconductor industry for 2010 and beyond. These include:
* 2010: +19 percent based on: continuing recovery momentum (NB … this could be a lot, lot higher).
* 2011: +28 percent based on: peak of the structural cyclical boom (NB … this could stretch into 2012).
* 2012: +18 percent based on: normal cyclical market correction starting 2H-2012 (1H-2013?).
* 2013: +3 percent based on: market correction in full flow (NB … this could be negative).
The year 2014 could well see the start of the next cyclical recovery! Given the impending 2010 fab shortage, the upside for 2010-12 is said to be huge.
The 2009 forecast – how did we do so far?
First, let’s look at the 2008 forecasts:
Q4-08 Forecast (Jan): -22.5 percent, making overall Year -2.3 percent
* Q4 (Dec) Guidance: (Intel -20 percent, Nvidia -40/-50 percent, Broadcom -20percent/-23 percent. TSMC -30 percent, Others –20/-50 percent-ish
* Q4-08 Actual: -24.2 percent, making 2008 YoY -2.8 percent (both slightly worse).
Now, on to the 2009 forecasts:
* 2009 forecast (Jan): -28 percent.
* Q1 -20 percent (continuing Q4’s decline, but at a slower rate).
* Q2 -2 percent (market settling down and decline bottoming out).
* Q3 +12 percent (normal, but slightly subdued seasonal and structural growth).
* Q4 +3 percent (normal 4th quarter seasonal slowdown).
* Q1-09 Actual: -15.3 percent (better than Jan. forecast). Jan., not March, saw start of correction to Q4-08’s over-reaction.
* Q2-09 Actual: +16.9 percent (Much better than Jan. forecast). Also, Q1 (not Q2) was the trough with a strong April-June rebound.
* Q3-09 Outlook: +12 percent (No change In Jan. or Jul. forecast). The Q2 inventory correction spurt over with ‘normal’ seasonal growth.
* Q4-09 Outlook: +3 percent (No change in Jan. or Jul. forecast). The normal 4th quarter seasonal slowdown.
2009 Forecast (Jul): -14 percent (Much better than Jan. forecast/no change from Jul.). Minor downside risks (Q3 +8 percent and Q4 +2 percent. making year -16 percent). There is a significant upside potential (Q3 +16 percent and Q4 +4 percent, making year -12 percent).
What’s changed since January’s IFS2009?
According to Malcolm Penn, Future Horizons’ ‘Rose Glass’ scenario came true! He said: “We correctly forecast the pattern of the recovery. The rebound came one quarter earlier than expected.” Given below is a snapshot of what’s happened since the IFS2009 in January.
In January, the world was reeling from Q4’s unprecedented collapse with December peppered with last minute Q4 downward guidance warnings. Everyone was affected – from Intel downward, the collapse was a total meltdown and completely across the board – covering all markets and regions.
Next, there was absolutely zero visibility into the first quarter guidance. Many firms refused to even comment. Some said, “We Simply Have No Idea!” Others offered such a wide range of options that the guidance was meaningless.
The December’s WSTS results (released early Feb.) showed December (and hence, Q4) slightly worse than the Oct/Nov momentum at -24.2 percent (vs. –22.5 percent). The March’s WSTS results (released early May) showed March (and hence, Q1) slightly better than the Jan/Feb momentum.
In brief — from meltdown (Q4-08) to stabilisation (Q1-09) and rebound (Q2-09) in three quarters — even for the chip industry dynamics, this was unprecedented, said Penn.
I will be adding more here, a bit later… stay tuned!
18pc Q2 vs. Q1 sequential growth… this improves 2009 to -14pc: Semicon update July. ’09
Here are the excerpts from the Global Semiconductor Monthly Report, July 2009, provided by Malcolm Penn, chairman, founder and CEO of Future Horizons. There are a lot of charts associated with this report. Those interested to know more about this report should contact Future Horizons.

Fig. E1: 12/12 Worldwide IC Monthly Growth Rates
Figure E1 shows the 12/12 worldwide monthly growth rates for IC sales in dollars, units and ASP for January 1997 to May 2009 inclusive. They need to be looked at in conjunction with the other 12/12 and rolling 12-month charts provided in the Market Summary section of this report.
Following hot on the heels of April’s 16 percent month-on-month sales growth, May grew a further 0.9 percent sequentially (0.4 percent for ICs), putting June on track to break through the US$20 billion barrier, for the first time since the chip market collapsed last September.
It would also set up Q2-09 to show 18 percent quarter on quarter growth, joining only three such precedents in the history of the industry when such a strong second-quarter growth spurt has occurred. The big question now is: “Is this the start of the chip market recovery or a blip on the statistics radar screen?” The short answer is both, the industry’s not out of the woods yet, but the chip market will recover faster than the economy. The stage is now set for a strong market rebound in 2010-11.
We are clearly in the midst of a serious industry recession but different from all previous historical precedents. As we have counselled before, going into this recession (the 12th in the industry’s 60-year history) the industry was in structurally good shape; that is something that has rarely happened before.
In addition, while the economy clearly drives the overall market for semiconductor devices, the correlation is poor meaning chips march to their own drum not just the economic pulse. Both of these factors mean that the chip market can (and will) recover much faster than the economy as a whole.
With the benefit of hindsight, the whole world clearly over-reacted to the 14 September 2008 Lehman Bros collapse, something again with hindsight the US officials probably now regret letting happen, and the massive destocking that followed masked the underlying residual demand. For sure markets too were down but they only declined not evaporated completely. The impact on IC unit demand was a victim of this uncertainty. Read more…
What needs to be done to boost chip designing activities in India?
 Anil Gupta, Technovation 2010 and UK CIG Convener, India Semiconductor Association (ISA), also needs no introduction. As former managing director, ARM Embedded Technologies Pvt. Ltd, he has been a prominent figure in several industry events. Here, he presents his views on what needs to be done for the Indian semiconductor industry.
An interesting fact being brought up time and again within the industry is the requirement of a robust entrepreneurial spirit and the need for much more sources of funding for semiconductor product companies. Also, renewable energy, healthcare and security are some of the verticals where the Indian industry believes there is a lot of value to be added from the Indian market/need perspective.
Further, local products/systems design and development activity needs to be encouraged and kick-started in a big way in India, for the industry to really succeed big time!
What does Indian semicon need?
We have discussed several times in the past regarding what needs to be done with the Indian semicon industry. So, what really needs to be done, given the current slowdown? What can be done boost chip designing activities in India.
According to Anil Gupta: “The Indian story has always been a story of a lot of potential, but most often this potential is never realized.
“The software industry has done well and has gone far, perhaps, somewhat farther than the hardware or chip-design industry in India. However, you still don’t see a software product conceptualized, designed and developed in India that is worth mentioning.
“The Infosys’es and the I-Flex’es can do a phenomenal job of executing software projects for their customers, but they are all a far cry from the league of the top consulting firms that define the problem to be solved and the software solutions to be built.
“The Indian software industry is still plagued with the “revenue per head” model and is unable to grow beyond it. The Indian software companies clearly bring a significant value to their customers but this is NOT strategic value, it is merely an execution value.
“Compared with the software industry, the embedded systems industry in India is puny today. However, the opportunities are phenomenal because there is so much automation potential in so many verticals. However, once again, the lack of significant products/solutions development in India is a very big hindrance.”
From a technical expertise perspective, there is a lot of engineering talent available, but the expertise is in general quite shallow. Even in the open source space like Linux, there aren’t many noteworthy contributions to date from the Indian engineering community.
Is the Indian fab story truly dead and buried?
In the past, we have extensively discussed whether the Indian fab story was dead and buried. Do you see any change in the current situation?
Well, it is dead for now! Gupta added: “Its day will come ONLY when the economics works out in its favour. Today, it doesn’t!”
He said: “It is interesting that many point out to the success of the solar fab investments. However, it should be noted that there is no solar wafer manufacturing activity worth mentioning. Only modules are being assembled in India as there seems to be a global glut in wafer production. Thus, wafer fabs in India is a pipe dream for now since the economics doesn’t work out.”
Does India have entrepreneurs committed to product development and willing to take that risk? How can they be encouraged?
Gupta said that there are not that many who are willing to come out and take the risk, and the lack of funding is a very big handicap. The lack of prior successes that could be emulated is probably the biggest handicap.
In that case, what needs to be done in India to move up a higher level, beyond design and verification?
He said: “Clearly, a willingness to take risk, strong stomach to face failure, and strong will to learn from that failure to rise again from the ashes!”
Global semicon mid-year review: Chip market revival or blip on stats radar screen?
A recent report from Future Horizons suggests an 18 percent growth for the chip market in Q2-2009! So, is this a sign of the chip market recovery or a mere blip on the statistics radar screen?
It is both, said, Malcolm Penn, chairman, founder and CEO of Future Horizons, and counselled that: “The fourth quarter market collapse was far too steep — a severe over-reaction to last year’s gross financial uncertainty — culminating with the Lehman Brothers collapse in September. The first quarter saw this stabilise with the second quarter restocking, but there are other positive factors also in play.”
Examining a bit further, here’s what he further revealed. One, the memory market is seeing some signs of slow recovery. He said, “This has already started DDR3 driven!” Likewise, companies are also in the process of revising their forecasts. The reason, Penn contended, being, “The maths has changed dramatically since Jan 2009!”
According to him, factors now leading to conditions looking up in H2 2009, include the normal seasonal demand — from a tight inventory base — and tightening capacity. There is also a clear indication of the correction phase to rebalance over-depleted inventories having started. “This is what’s driving Q2’s high unit, and therefore, sales growth,” he contended.
Firms advised to stop seeing and waiting!
This isn’t all! Penn further counselled firms who are still in a wait-and-see mode to ‘stop seeing and waiting’! Next, fabs are also looking to maximize their returns. For one, they have stopped over-investing.
Do we have enough stats from others to back up what’s been happening in the global semiconductor industry? Perhaps, yes!
IC Insights stands out
First, look at IC Insights! It has stood out by pointing out in early July that H2-09 is likely to usher in strong seasonal strength for electronic system sales, a period of IC inventory replenishment, which began in 2Q09, and positive worldwide GDP growth.
IC Insights has predicted global IC market to grow +18 percent; IC foundry sales to grow +43 percent; and semiconductor capital spending to grow +28 percent in H2-09.
DDR3 driving memory recovery? Flat NAND?
Elsewhere, Converge Market Insights said that according to major DRAM manufacturers, DDR3 demand has been on the rise over the last two months and supply is limited.
This is quite in line with Future Horizons contention that there is a DDR3 driven memory recovery, albeit slow. It would be interesting to see how Q3-09 plays out.
As for NAND, according to DRAMeXchange, the NAND market may continue to show the tug-of-war status in July due to dissimilar positive and negative market factors perceived and expected by both sides. As a result, NAND Flash contract prices are likely to somewhat soften or stay flat in the short term.
Semicon equipment market to decline 52 percent in 2009!
According to SEMI, it projects 2009 semiconductor equipment sales to reach $14.14 billion as per the mid-year edition of the SEMI Capital Equipment Forecast, released by SEMI at the annual SEMICON West exposition.
The forecast indicates that, following a 31 percent market decline in 2008, the equipment market will decline another 52 percent in 2009, but will experience a rebound with annual growth of about 47 percent in 2010.
EDA cause for concern
The EDA industry still remains a cause for concern. The EDA Consortium’s Market Statistics Service (MSS) announced that the EDA industry revenue for Q1 2009 declined 10.7 percent to $1,192.1 million, compared to $1,334.2 million in Q1 2008, driven primarily by an accounting shift at one major EDA company. The four-quarter moving average declined 11.3 percent.
If you look at the last five quarters, the EDA industry has really been having it rough. Here are the numbers over the last five quarters, as per the Consortium:
* The EDA industry revenue for Q1 2008 declined 1.2 percent to $1,350.7 million compared to $1,366.8 million in Q1 2007.
* The industry revenue for Q2 2008 declined 3.7 percent to $1,357.4 million compared to $1,408.8 million in Q2 2007.
* The industry revenue for Q3 2008 declined 10.9 percent to $1,258.6 million compared to $1,412.1 million in Q3 2007.
* The industry revenue for Q4 2008 declined 17.7 percent to $1,318.7 million, compared to $1,602.7 million in Q4 2007.
Therefore, at the end of the day, what do you have? For now, the early recovery signs are more of a blip on the stats radar screen and there’s still some way to go and work to be done before the global semiconductor industry can clearly proclaim full recovery!
Before I close, a word about the Indian semiconductor industry. Perhaps, it needs to start moving a bit faster and quicker than it is doing presently. Borrowing a line from Malcolm Penn, the Indian semiconductor industry surely needs to “stop waiting and watching.”
I will be in conversation next with iSuppli on the chip and electronics industry forecasts. Keep watching this space, friends.
Green shoots or desert? V, U, W-shape or alphabet spaghetti?: Semicon update Jun'09
Here are the excerpts from the Global Semiconductor Monthly Report, June 2009, provided by Malcolm Penn, chairman, founder and CEO of Future Horizons. There are a lot of charts associated with this report. Those interested to know more about this report should contact Future Horizons.
It will be quite interesting to see whether the so-called fab shortage does happen in 2010, given that there might not be enough capacity to handle demand… (Are Indian fab backers listening?) In the meantime, I am awaiting Malcolm’s responses. So, watch this space!
Executive overview
“On the face of it, April’s data showed a 7.6 percent decline in total semiconductor sales versus March 2009 but, after adjusting for the five-week long March, this translates into a whopping 15.5 percent growth. The corresponding numbers for total ICs were minus 9.3 and plus 13.4 percent respectively. This is the strongest April month-on-month growth since April 1996. That’s the good news!
Given the still delicate state of the global economy, this growth is not however directly driven by increased end-user demand, instead it is purely a correction to the steep Q4-08/Q1-09 inventory declines.
In other words, the markets clearly over-reacted to the September 2008 global economic collapse, sucking the supply chain dry, paving the way for this counter-balancing period of inventory replenishment. Historically, we can expect this to last through to Q3-09. Beyond that, growth will depend on the underlying end-market demand.
What then does this mean for the 2009 outlook? Whilst much of the current industry tittle-tattle focuses on the ‘green shoots of recovery’ debate (are there/aren’t there?) and/or the ‘shape of the downturn’ (V, U, W, sharp, stretched, extended, etc), we prefer to take a more sober look at the underlying trends.
As mentioned in our May Global Semiconductor Report, at minus 24.2 percent growth, Q4-08 was a little worse than our 22.5 percent January IFS forecast, whereas Q1-09’s 15.5 percent fall was slightly better than out minus 18 percent number.
The counterbalancing overall effect of the two was to put the 2009 market slightly ahead of our official minus 28 percent forecast, to minus 25.3 percent. In our book, this does not constitute a ‘forecast revision’ given that basic forecast assumptions and analysis had not changed; it was merely ‘finetuning the number’. So far, so good!
Q2-09, however, might well be different in that it now looks to be coming in with the growth in the 4-5 percent range, versus our -2 percent January estimate. If true, it would represent a material change to our 2009 forecast, improving it from -28 percent to -21.3 percent, assuming that the second half of the year rolled out as planned, and removing most of the down-side risk potentials. Our verdict on this will be presented at our upcoming July 21st Mid-Term Industry Forecast Seminar in London.
In the meanwhile, here is a snapshot of what is actually going on in the markets. The first quarter was clearly a difficult time for the industry, the combined effect of the global recession on top of the normal Q1 seasonality weakness. Not quite a knockout punch, but a real double-whammy. Based on a reasonable cross industry sampling, the overall result was a net 12 percent fall in electronic equipment sales versus Q1-08.
Aside from government/military — the only sector to grow — every market and geographic region was negatively impacted, with Japan and Taiwan/China the worst hit, the latter however being the first to show a rebound.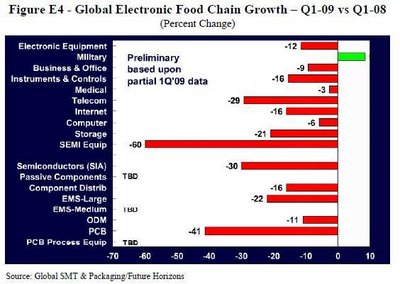 Source: Future Horizons
Looking at the key mobile and PC industry sectors, both of these have been hit badly by the discretional consumer spending slowdown, with Q1-09 phone and PC unit sales down 16 and 20 percent respectively versus Q1-08.
Given the magnitude of these declines — all markets, all sectors, all regions, all customers, consumers and enterprise — the industry and chip market exited the first quarter in remarkably good shape relatively speaking. That is, not to say that it will be plain sailing hereon out, far from it, but that the industry has clearly weathered the worst of the storm, bloodied but (mostly) not beaten.
The 12 percent, 16 percent and 20 percent OEM, mobile and PC sales declines are key industry benchmarks in that they represent the absolute worst-case full-year scenarios. Our January 2009 forecast called for 8.2 percent, 15 percent and 22 percent declines here, respectively, which are all well in line with the way the market is unwinding. Given that we expect the Q1-09 12:12 declines to improve as the year rolls out, the downside risks to our forecast are clearly diminishing.
From an economic perspective, our 8.2 percent electronic equipment industry decline was based on the then IMF’s World GDP growth forecast of plus 1.8 percent. This however has been subsequently revised down three times, first to +0.5 percent on January 28, then to -0.5 to -1.0 percent on March 13, to the current forecast of -1.3 percent in the April 2009 World Economic Output Report.
Intuitively, one would worry that these downward revisions ought to force a corresponding revision to the electronics equipment market; in reality this does not seem to be the case.
Which in turn beggars the big unanswerably question: “to what extent are these downward revisions to world GDP growth the cause or effect of the electronic equipment industry decline and what impact will their downward revision, and for that matter subsequent recovery, have on the 2009 and beyond electronic equipment industry absolute growth number?”
The bottom line answer? No one really has the faintest idea; moreover, it is impossible to calculate. While anecdotally and intellectually, there is an obvious link between GDP and electronic equipment industry growth rates, the electronic equipment industry represents only 2-3 percent of total world GPD. In contrast, at their peak, the financial derivatives markets totalled 120 percent of world GDP!
With recession, cutbacks clearly hit the electronic equipment industry early, as both enterprises and consumers hit the ‘stop spending’ button relatively quickly. In the case of the 2008 downturn, for ‘relatively quickly’ read ‘instantaneously fast’. The impact on the chip market is immediate, aggravated by the associated component and WIP inventory burn, with overshoot inevitable.
Inventory levels clearly stabilised during Q1-09 and are being rebuilt in Q2, most probably targeting an electronics equipment production level 12 percent down on this time last year, i.e. in line with first quarter actual. This being the case, the industry will have adjusted much faster than in previous cycles, with today’s inventory imbalance levels already peaked and much more in line with the 2H-06 ‘course-adjusting’ excess than the post-dot com bubble burst 2001 flood.
To summarise, the downside risks to the 2009 market are clearly abating with our 13 percent third quarter growth forecast still looking reasonably robust, given the current inventory rebuild plus a touch of seasonal strength. Likewise, it is still credible for this to be followed by a seasonally weak 3 percent forth quarter growth given the normal end of year inventory clean out.
With the global economic recovery then starting to gain traction in 2010, a ‘normal’ quarterly (-2 percent, +2 percent, +14 percent, +3 percent) 2010 growth pattern would be reasonable, yielding a 2010 annual growth of around 17 percent, well in line with our ’15 percent with lots of upside potential’ January 2009 forecast.
While the slightly revised 2009 quarterly growth pattern would call for a
n (upwards) formal forecast revision to the actual ‘growth number’, the underlying market analysis and assessment presented at our January 2009 Forecast Seminar will not have materially changed, either for 2009 or 2010.
Market summary
We tracked the worldwide and European 12/12 industry growth rates for ICs, Opto, and Discrete Devices from January 1998 to date. These show the current month as compared with the same period 12 months ago, and are a useful industry momentum indicator. We also show 15-month rolling worldwide and European sales by major product category.
Industry capacity
Overall MOS wafer fab capacity decreased by 7.8 percent in Q1-09 versus Q4-08, from 2110.4k 200mm equivalent wafer starts per week to 1945.1k. Whilst no category was immune, the decreases were highest in the 200mm and below wafer sizes, and at 150nm and tighter feature sizes.
These cutbacks add to the previous quarter’s 1.6 percent decline and compared with a 1.7 percent quarterly growth this time last year. Whilst some of the decline can be attributed to closing of older lines due to the recession, for the most part they are the direct result of the deliberate slowdown in capital expenditure that began mid-2007, well before the current recession started.
The 300mm wafers now account for 50.1 percent of the total MOS capacity, up from 48.2 percent in Q4-08 and 40.7 percent from the same period last year. 300mm wafers now account for over half the total capacity, with 200mm in second place at 37.7 percent, down from 39.1 percent in Q1-09 and 45.7 percent in Q1-08.
At 733.5k wafer starts per week, Q1-09 200mm capacity continued its absolute value decline, from 826.0k in Q4-08, a fall of 11.2 percent. 200mm capacity is now down 22.8 percent versus the same period last year.
Even advanced capacity (i.e., 0.08 micron and below) declined, primarily due to the DRAM firm’s bankruptcy problems. Only the 120-159nm category, escaped with capacity up 1.4k wafer starts per week, or 0.6 percent.
Despite sizeable capacity decrease, Q1 utilisation rates plummeted still further to 57.2 percent, from 87.5 percent in Q3-08 and 68.4 percent in Q4-08. The comparable figure for Q1-08 was 90.7 percent. Advanced IC capacity, i.e., 0.08 micron and below, also fell to 69.9 percent (from 84.4 percent in Q4), whilst 300mm and 200mm wafers checked in at 72.8 percent (Q4 = 83.2 percent) and 44.0 percent (Q4 = 55.5 percent), respectively.
The fall in Q4-08/Q1-09 utilisation rates was a result of massive order cancellations and demand collapse triggered by the September 2008 Lehman Brothers ollapse and was much faster and deeper than the 2001 dot-com driven recession. Q1 is however expected to be the trough, with rates climbing back fast in Q2 and thereafter.
Given the significant cutbacks in capex since mid-2007, we expect to see utilisation rates trending back to the 90 percent ‘full capacity’ threshold much faster than in previous recessions, accelerating the supply-side recovery dynamics by at least four quarters.
Fab shortage waiting to happen?
Looking ahead to 2010, demand should start to accelerate in line with the anticipated global economic recovery, tightening the capacity screw still further. And, with 2010’s capacity fixed by 2009’s spend, at a currently estimated $20 billion, this spend represents barely one third its 2000 $60 billion peak. That means, in round numbers, 2010’s new capacity will be only 40k 200mm wafer starts/week minus any capacity closures.
We have said it before and we will say it again. There will not be enough 2010 capacity in place to meet demand… this is a fab shortage waiting to happen!”
March's data validated forecast; Q1 WAS cyclical bottom! Semicon update May'09
Here are the excerpts from the Global Semiconductor Monthly Report, May 2009, provided by Malcolm Penn, chairman, founder and CEO of Future Horizons. There are a lot of charts associated with this report. Those interested to know more about this report should contact Future Horizons.
This will be followed by the update for June, and I am speaking with Malcolm Penn to find out more!
Executive overview
“At $14.085 billion, March’s IC sales were up 28.4 percent versus February, equivalent to plus 2.7 percent on a five-week month adjusted basis. Whilst this still puts the market down 31.2 percent versus March 2008, the momentum that started in January 2009 continues to steadily gain traction.
Overall, the ICs in Q1 were down just 13.4 percent in value, comprising a 19.6 percent fall in units offset by a whopping 7.8 percent gain in ASPs. At the total semiconductor level, sales came in at $17.271 billion, up 27.1 percent on February (1.7 percent on a 5-week month adjusted basis), slightly higher than our $17.019 billion April Report estimate.
Q1 was thus down only 15.7 percent on Q4, sizeably better than our 18.5 percent estimate. This is good news for industry… ‘ah but’ say the sceptics!
During our January 2009 International Forecast Seminar, we took the view that, from an economic recovery perspective, things would stabilise during the first half of the year, starting to gain traction by the end of 2009, given the dramatic economic stimuli since September 2008. The recovery would then accelerate quite fast in 2010-11, i.e. following a similar pattern as to what happened after the 2000 dot-com crash. There is every reason to believe this will still be the case.
Until recently, the big industry problem was uncertainty but there have been no horrible surprises now for several weeks and things do seem like we are bumping along the bottom. The global economy has stabilised; there have been no new gut-wrenching surprises and the ‘unknown unknowns’ in the economy have subsided. This means we are now left facing the ‘known unknowns’, which is clearly something that industry can adjust to and deal with.
Despite its severity, there are also many mitigating circumstances. At the personal level, this recession is quite like no other. For those without a job, or on short-time working, it is clearly bad news as no one is currently hiring. But, those with a job ironically have never been better off, with inflation, mortgage interest rates and repayments (the single biggest expense item on the personal expense budget) at rock bottom levels. This is very unlike the past recessions, which were accompanied by high inflation and cripplingly high interest rates.
Another factor is that no one really knows how much of the current GDP shrinkage (and for that matter the previous five-years above average growth) is (was) smoke and mirrors. With CDIs valued at 1.2x total world GDP in 2007 only to be written down to junk bond status the following year, the absolute GDP and growth rate numbers have been compromised. That makes it hard to judge what they mean from a top down perspective, more so when one considers the total electronics manufacturing industry’s contribution to world GDP is barely 3 percent.
Finally, even though cars, mobiles, PCs etc may fall in unit terms by ’15-30 percent’ this year, that still means ’70-85 percent of the market’ remains. With inventory levels everywhere in the value chain at all-time lows, we are currently back now building to demand from newly bought components, albeit some 20 percent lower than the 2008 highs.
At the chip level, the market is obviously driven by the economy but it also has its own drivers, especially capacity and ASP trends. Thus, whilst the existence of a link between the chip market and the economy is clear, mathematically the nature of this link is imprecise. Dislocations in growth dynamics are thus relatively frequent.
What then of our January 2009 quarterly growth pattern (Q1 -18 percent, Q2 -2 percent, Q3 +12 percentand Q4 +3 percent)? Clearly Q1, at -15.7 percent, was better than forecast which, if the rest of the growth pattern continues as planned, would rein in the full year market decline slightly from -28 to -25.3 percent, but still within the forecast margin of error. Q1 has thus reinforced, not altered, our January prognostications.
If Q1’s stronger momentum however carries through into Q2, Q2 would come in much stronger than our 2 percent decline, say to plus 2 percent instead. This would positively change our forecast dynamics with a further two percentage points improvement on the full year’s number, improving our forecast from -28 percent to -23.2 percent. Whilst we are not yet prepared to call for a formal forecast revision, the odds are in its favour and the downside forecast risks dispersed.
Clearly Q1 was the cyclical bottom; from here on out the growth trends will be up. Once the inventory purge is over, excess capacity will soon be absorbed with a corresponding strong recovery in utilisation rates. Given capex is currently at an 18-month all time low, with no near-term correction in prospect until late Q3-Q4 at the earliest, the industry will enter 2010 staring into a new net capacity famine.
We definitely will be revising our 2010 forecast up, from the current +15 percent to the mid-to high twenties.
Industry capacity
The table C1 shows the quarterly semiconductor equipment sales trends for the period Q1-2008 through Q1-2009 inclusive. The total Q1-2009 equipment sales were $3,235 million, down 31.4 percent from Q4-2008, which in turn was down 28.1 percent from Q3-2008. This represents the biggest sequential falls in the history of the chip industry.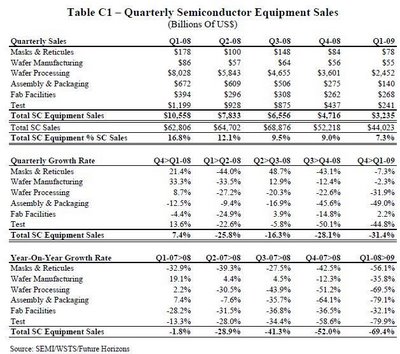 Source: Future Horizons
Wafer processing equipment represented 76 percent of the total, just slightly higher than its 75 percent average. Total Q1-2009 investment represented only 7.3 percent of the quarterly semiconductor sales, although it must be remembered that an equipment sale in Q1-2009 will not produce incremental semiconductor sales until three quarters later, namely Q4-2009.
Q1-2009 wafer fab equipment sales were down a staggering 69.4 percent on Q1-2008, the fourth consecutive quarterly high double-digit drop, with further declines in the prospect. Capex levels are now running at levels not seen since the early 1990s when the overall chip market was one-third its current size.
As mentioned earlier, Q1-2009 was down 31.4 percent versus Q4-2008, on top of the three previous quarterly declines of 28.1 (Q4 vs Q3), 16.3 (Q3 vs Q2) and 25.8 (Q2 vs Q1) percent respectively. It should not be forgotten that these cutbacks were not triggered by the current chip market recession; the first two quarterly drops, namely Q2 and Q3-2008, took place against a backdrop of strong IC unit growth, i.e., well before the Q4-2008 chip market collapsed.
The cutbacks were a clear intent to engineer tight capacity, a strategy that would by now have bitten home were it not for the cruel interruption on the Q4-2008 market collapse. We have never before seen such an extensive cut back prior to a collapse; ironically this will help the recovery process, albeit for the wrong reasons. It will also underpin the underlying strategy — post recession IC capacity is going to be tighter than tight.
We also tracked the total semiconductor equipment sales by month since January 1988, both in absolute value and as a percent of semiconductor sales. One significant feature that can be seen from these trends is that the absolute value of the total semiconductor equipment sales has been significantly lower than the previ
ous 1999-2000 investment peak, despite the fact the total semiconductor market has expanded in size.
During this same time period, the investment trend relative to the size of the total semiconductor market has also been trending well below its long-term 16.75 percent average, despite this being a period of heavy 300mm conversion.
The corresponding data for the Wafer Processing equipment sector, shows an increasing trend as a percent of semiconductor sales. This trend, however, is not a sign of excess investment, rather that the wafer processing portion is gaining overall market share, currently at around 75 percent of the total equipment spend, up from around 60 percent in the late 1980s.
We also tracked the total capex spent as a percent of semiconductor revenues on an annual basis since 1990-2008, and data but for the total semiconductor equipment spend. We also tracked the relative relationship between the wafer processing and total semiconductor spends.
These show that a higher proportion of revenues are being spent on the wafer processing sector, a trend that we believe is likely to continue.
We believe that the current levels of capex expenditure are unprecedentedly low and cannot be wholly accounted for improvements in productivity and factory loading. Even if they are, these gains are one-off improvements; once they have been realised there is no more gain in prospect and expenditure levels will return to ‘normal’ trends.
We tracked the wafer processing equipment spend versus the corresponding increase in capacity on a quarterly basis since Q1-1999 but with the capacity increase delayed by three quarters.
Once the three-quarter slippage in introduced into the equation, the overlay of the two curves, whilst not perfect, is a very good fit. In short, it takes three quarters for increases in wafer processing spend to translate into new capacity. This is the time it takes to hook up and calibrate the kit and make it volume production ready. Add to this an additional one-quarter delay through wafer fab and assembly process, the net result is a one year delay from wafer processing spend to incrementally more IC shipments out.
Adding in a further one-quarter lead-time for equipment delivery, results in a typically 15 month delay for an existing clean room structure from wafer processing investment decision to increased unit sales, one year longer still if a new building is required.
These long lead-times, however, have a positive side in that one has excellent visibility three quarters out into how much additional capacity is due to come on stream, just by analysing the front-end capex spend numbers. Once the frontend
capex is committed, the addition capacity is inevitable, needed or not, the difference being determined by the capacity utilisation number.
One is thus making an investment decision based on a unit demand forecast 12 months down the road, which would not be so problematic were demand more predictable.
As can be seen, however, from the unit sales charts in the Market Summary section of this report, IC unit demand fluctuates violently from its underlying long-term ten percent per year annual growth rate on a month-by-month basis, quarter-by-quarter basis, not withstanding the inevitable — and unavoidable — routing inventory adjustments.
The biggest single problem with semiconductor capex is thus both the long time delay from investment decision and additional IC units out and the non-linearity of the month-by-month unit demand. It is this mismatch that gives rise to the investment uncertainty. Getting the investment timing right, however, is not an exact science; there are bound to be ongoing capacity mismatches within this overall favourable trend.
Entering 2009, the current new capacity investment is trending well below the long-term trend, and is projected to slow even more so in 2009 as the economic recession bites home. This means over-investment is not going to accentuate the current industry downturn, as has so often happened before.
This time it seems investment has been deliberately slowed in order to improve the return on capital employed. The seeds have also been sown for the next market shortage in 2010-11. Foundry wafer prices will rise; dust down the ‘makebuy’ Excel spreadsheets … the ‘fablite’/IDM debate dynamics has yet to run its course.”
Is Q1 a cycle bottom? Time for 2009 reality check! Semicon update Apr'09
Here are the excerpts from the Global Semiconductor Monthly Report, April 2009, provided by Malcolm Penn, chairman, founder and CEO of Future Horizons. There are a lot of charts associated with this report. Those interested to know more about this report should contact Future Horizons.
This will be followed by updates for May and June, and I am speaking with Malcolm Penn to find out more!
Executive overview
“February’s IC sales were up 4.3 percent on January, down 26.5 percent on the same time last year. If March behaves true to historical norms, we can expect to see sales up 26 percent on February, at 14.3 billion (on a calendar month basis), equivalent to plus 0.8 percent, four-week month adjusted.
This would see Q1 sales down around 15 percent on Q4-2008, just slightly ahead of our 18 percent forecast decline. Whilst March’s data point is right now still an estimate, the year to date data and trends give strong guidance on what is actually happening. Time therefore to reflect on our 2009 chip market forecast and growth pattern outlook for the year as a whole.
At our January 2009 International Forecast Seminar in London, we forecast growth for the 2009 market at -28 percent. This was the most pessimistic of all the industry watchers! Source: Future Horizons
The forecast reflected the unprecedented Q4-2008 industry meltdown that started on Sept 16 with the Lehman Brothers collapse. December was an especially a traumatic month, with several firms reporting negative net monthly sales (i.e., cancellations were higher than new orders), with zero guidance visibility on the outlook for Q1-2009.
Our forecast estimated Q4 would decline a 22.5 percent versus Q3, followed by a similar (but slightly slowing) decline of 20 percent in Q1, bottoming out in Q2 (at -2 percent versus Q1) followed by reasonably strong seasonal recover in Q3 and Q4 of plus 12 percent and plus 3 percent respectively.
Once December’s results were published in February, we modified this profile slightly to reflect December’s actual 24.2 percent decline (versus our 22.5 percent estimate), reducing the first quarter decline slightly (from -20 percent to -18.5 percent) thereby maintaining the overall year-on-year 28 percent decline.
Ironically, despite having the most pessimistic overall year-on-year forecast, we were widely criticised at the time for predicting a ‘V-shaped’ recession. Yet, to achieve the more favoured ‘U-shaped’ recovery would have meant a very low single digit quarterly decline in Q1, something we did not believe was realistic or likely. Our most optimistic (rose coloured glasses) scenario pegged Q1 growth at -8 percent, yielding an 18.7 percent annual 2009 decline.
Despite December’s worse than forecast results, February’s data, both in its absolute value and underlying momentum, added credence to our ‘V-shaped’ scenario, despite the emergence of a new popularist theory of a W-shaped recovery.
As such, we are sticking to both the shape of the recovery — V, not U or W — and profile; there is even some indication that the recovery is happening slightly earlier than we estimated. Now that, if true, would soften the depth of the 2009 decline.
Based on January and February’s WSTS data, March now looks like coming in at $17.019 billion, which would see Q1 reach $43.642 billion, down 16.4 percent on Q4-2009, which is 2 percentage points lower than the 18.4 percent we were forecasting. If this is the case, Q1 will mark the recession cyclical bottom.
Industry capacity
The Q4-08 total MOS IC capacity was up just 3.1 percent versus Q4-07, which in turn was up 13.6 percent on Q4-2006. Quarter on quarter growth was -1.7 percent, compared with +1.1 percent for Q3-08, plus 2 for Q2-08 and +1.7 percent for Q1-08. This dramatic slowdown in net new capacity is in direct response to the slowdown in capex that has been gaining momentum since the second half of 2007.
It should be remembered that there is a ‘nine-month delay’ between a capex spend and saleable units out, so capex in year ‘n’ drives capacity expansion in year ‘n+1’. As such, the capex spend is now growing much slower than the underlying unit demand, and the impact is an eventual increase in the capacity utilisation rates.
Do not be misled by the sharp falloff in Q4-08 utilisation; this was the direct result of the September financial crisis near-term inventory purge driven demand slump and not representative of the underlying trends. We expect this to bounce back quite rapidly once orders readjust during the first half of 2009.
Although due to timing, inventory and seasonality issues, supply and demand will never identically track, utilisation rates have been straddling the 90 percent level since mid-2003. We expect this trend to resume by the end of this year.
With capex spend averaging around US$8 billion per quarter between Q3-06 and Q1-08 spending plunged dramatically in Q2-08 reaching under half this average in Q4-08. Given the current front-end capex book-to-bill trends, this spend will shrink still further at least through 1H-2009. Interestingly, this cutback happened well before the Q4 market meltdown, the impact of a premeditated strategy to dramatically tighten supply and thereby increase wafer and IC average selling prices.
The level of new front-end capital equipment orders has now been sizeably lower than sales for 31 consecutive months, the last four at unprecedentedly low levels, aside from two short-lived incursions into positive territory circa Q4-06 and Q4-08. The 2008 capex spend was down 30.6 percent on 2007’s level, with the outlook for 2009 looking to be at least a further 30 percent lower. That would put 2009’s capex spend at well under half 2000’s peak.
No amount of productivity gains can offset this slowed investment, especially now the one-off 300mm conversion gain has been absorbed. Net new capacity addition is thus condemned to shrink even further during 2009, the effect of which will be masked in the near-term by the current inventory /demand adjustment process.
With near-term demand having shrunk in Q4, this strategy has essentially been blocked but not reversed. Unlike 2001, when recession hit during a period of capex expansion, the bounce back from the current dip will be quite sharp and sudden. It is only a matter of time before capacity gets squeezed and wafer process rise. We expect this trend to bit hard in 2010, possibly even leading to shortages and allocations, just as the economic recovery starts to gain momentum.
The interim period of ‘plentiful capacity in 2009’, will feed the perceived wisdom of a sense of supply security, those with an inkling of a medium-term plan need to tie down their supply positions whilst the going is good. Today’s era of cheap and plentiful wafers, like the discredited ‘debt is cheap and free’ era, are number and counting down.
Just to make the point deeper we tracked the book-to-bill ratio against future capacity adjusted for the three quarter lead-time delay. It shows both a good trend correlation and the depth of the problem. Once again, it reinforces all of the other anecdotal and hard evidence that net new capacity growth is condemned to slow even further. When the unit demand recovers, the capacity simply will not be there, especially at the leading edge technologies.”
