Archive
Reports of memory market recovery greatly exaggerated: iSuppli
EL SEGUNDO, USA: Concerned about their image as they face the specter of bankruptcy, many memory chip suppliers are attempting to paint a more optimistic picture of the business by talking up a potential market recovery.
However, while overall memory chip prices are expected to stabilize during the remaining quarters of 2009, iSuppli Corp. believes a true recovery in demand and profitability is not imminent.
After a 14.3 percent sequential decline in global revenue in the first quarter DRAM and NAND flash, the market for these products will grow throughout the rest of the year. Combined DRAM and NAND revenue will rise by 3.6 percent in the second quarter, and surge by 21.9 percent and 17.5 percent in the third and fourth quarters respectively.
“While this growth may spur some optimism among memory suppliers, the oversupply situation will continue to be acute,” said Nam Hyung Kim, director and chief analyst for memory ICs and storage at iSuppli.
“For example shipments of DRAM in the equivalent of the 1Gbit density will exceeded demand by an average of 14 percent during the first three quarters of 2009. This will prevent a strong price recovery, which will be required to achieve profitability for most memory suppliers.”
Painful oversupply
Due to a long-lasting glut of DRAM, the imbalance between supply and demand is too great for this market to recover to profitability any time soon.
“Even if all of the Taiwanese DRAM suppliers idled all their fabs, which equates to 25 percent of global DRAM megabit production, the market would remain in a state of oversupply,” Kim said. “This illustrates that the current oversupply is much more severe than many suppliers believe—or hope.”
Besides cutting capacity, which suppliers have already been doing, they presently have few options other than waiting for a fundamental demand recovery. iSuppli believes that another round of production cuts will take place in the second quarter, which will positively impact suppliers’ balance sheets late this year or early in 2010 at the earliest.
DRAM prices now amount to only one-third-level of Taiwanese suppliers’ cash costs. Unless prices increase by more than 200 percent, cash losses will persist for these Taiwanese suppliers.
While average megabit pricing for DRAM will rise during every quarter of 2009, it will not be even remotely enough to allow suppliers to generate profits in this industry. The industry needs a dramatic price recovery of a few hundred percentage points to make any kind of impact.
iSuppli is maintaining its “negative” rating of near-term market conditions for DRAM suppliers.
Confusing picture in NAND
The picture is a little more complicated in the NAND flash memory market.
Pricing for NAND since January has been better than iSuppli had expected. However, iSuppli believes this doesn’t signal a real market recovery.
Most NAND flash makers are continuing to lose money. The leading supplier, Samsung Electronics Co. Ltd., seems to be enjoying the current NAND price rally as prices have almost reached the company’s break-even costs. However, all the other NAND suppliers still are losing money.
“While the NAND market in the past has been able to achieve strong growth and solid pricing solely based on orders from Apple Computer Inc. for its popular iPod and iPhone products, this situation is not likely to recur in the future,” Kim said. “Even if Apple’s order surge, and it books most of Samsung’s capacity, it would require a commensurate increase in demand to other suppliers to generate a fundamental recovery in demand.”
However, iSuppli has not detected any substantial increase in orders from Apple to other suppliers. Furthermore, Apple’s orders, according to press reports, are not sufficient to positively impact the market as a whole.
It doesn’t make sense for major NAND suppliers Toshiba Corp. and Hynix Semiconductor Inc. to further decrease their production if there is a real fundamental market recovery. This means supply will continue to exceed demand and pricing will not rise enough to allow the NAND market as a whole to achieve profitability.
The NAND flash market is in a better situation than DRAM at least. However, the market remains challenging because fundamental demand conditions in the consumer electronics market have not improved due to the global recession.
One of the reasons why the price rally occurred is that inventory levels have been reduced in the channel and re-stocking activity has been progressing. Overall, memory suppliers will begin to announce their earnings shortly and iSuppli will remain cautious about the NAND flash market until we detect solid evidence, not just speculation, of a recovery.
iSuppli is remaining cautious about the near term rating of NAND market, holding its negative view for now, before considering upgrading it to neutral.
“Production cuts undoubtedly will have a positive impact on the market in the future. However, it’s too early for to celebrate. iSuppli believes the surge in optimism is premature. Supplier must be rational and watch the current market conditions carefully to avoid jumping to conclusions too quickly,” Kim concluded.
Top NAND suppliers of the world: DRAMeXchange
DRAMeXchange has recently released its rankings for the top NAND suppliers of the world. I am producing bits of that report here, for the benefit of those interested in NAND and the memory market.
Be aware, that this segment has been hit particularly bad. We have heard of Qimonda’s problems, as well as Spansion’s. They are trying to battle it out, gamefully, and best wishes to them.
The global semiconductor industry needs the flash memory segment to recover, and fast, to bring the health back in the industry, as well as the missing buzz!
Getting back to DRAMeXchange’s report, NAND Flash brand companies released their total revenue of 2008. Samsung’s annual revenue was $4.614 billion and it gained 40.4 percent market share, to maintain the number 1. position.
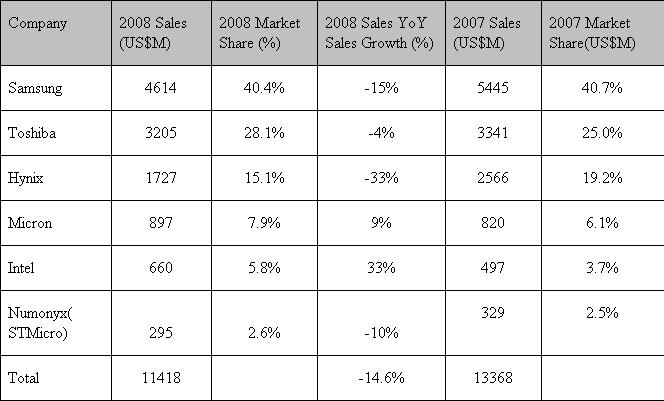 According to DRAMeXchange, the annual revenue of Toshiba was $3.25 billion, and its market share was 28.1 percent at the number 2 position. Its market share increased 3.1 percent compared to 2007.
Hynix’s annual revenue was $1.727 billion, with 15.1 percent market share. Though it stayed at the number 3 position, its market share declined 4.1 percent, compared to 2007.
Micron’s annual revenue was $897 million. It had a 7.9 percent market share, which enjoyed a 1.8 percent increase when compared to 2007. Micron was number 4. Intel was at number 5. Its annual revenue was $660 million with 5.8 percent market share, which increased 2.1 percent, compared to 2007.
Numonyx’s (STMicro) 2008 annual revenue was $295 million. It was at number 6 position with the market share of 2.6 percent, which remained the same as 2007.
According to DRAMeXchange, the 4Q08 total revenue of worldwide NAND Flash brand companies was $2.227 billion, which dropped 19.3 percent from $2.761 billion in 3Q08. Under the continuing impact of global recession and the influence of declining worldwide consumer confidence, the 4Q08 revenue of NAND Flash brand companies showed signs of decreasing.
The overall demand and expenditure for consumer electronics declined. Although bit growth in 4Q08 increased 18 percent QoQ, the overall average selling price (ASP) dropped 32 percent QoQ, says DRAMeXchange. A big thanks to DRAMeXchange.
Indian semiconductor market to reach $7.59bn by 2010!
 Folks, here’s the full report on the India Semiconductor Association – Frost & Sullivan study on the Indian semiconductor industry. I’ve already provided my views on the Indian semiconductor industry report in an earlier post, for those who would like to know more.
First, the findings:
• The Total Semiconductor Market (TM) revenues poised to grow from $5.9 billion in 2008 to $7.59 billion in 2010. The market is estimated to grow at a CAGR of 13.4 percent.
• The corresponding period is likely to witness a CAGR of 13.1 percent in the Total Semiconductor Available Market (TAM). TAM revenues is anticipated to climb to $3.24 billion in 2010 from $2.53 in 2008.
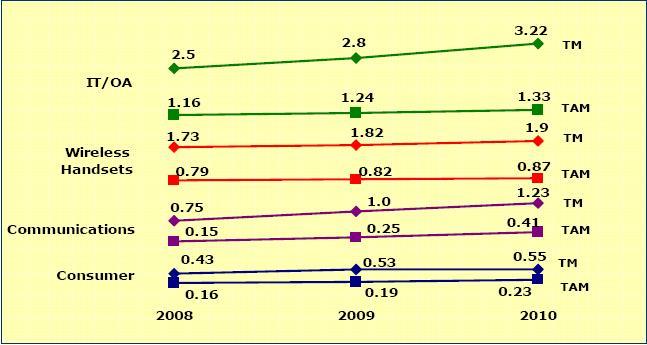 The following chart details how the Indian semiconductor industry is likely to shape up till 2010. All values are in US $ billion.
According to the study:
• Memory and MPU are the leaders in the TM and TAM revenues, respectively.
• IT/OA, wireless handsets and communications are the top three contributors to the TM revenues.
• IT/OA, wireless handsets and consumer are the mainstay of TAM revenue generation.
• Greater affordability of notebooks, netbooks, government IT initiatives, increased usage of memory cards to drive TM revenues from IT/OA. Ratio of desktops to notebooks reduces to 1:5
• Emphasis on rural mobile telephony and decline in handset pricesto drive demand; economically priced handsets in GSM and CDMA to witness higher growth. Mid priced handset segment, with enhanced features, to benefit.
• Rollout of 3G and WiMAX services to act as harbinger of associated infrastructure equipment TM. SDH 64 to increasingly replace SDH 4 and SDH 16. Increased manufacturing expected to favor TAM revenues.
• Evolving lifestyle expected to assist consumer electronics related semiconductor TM. DTH revolution creates demand for STB like never before. The market is expected to sustain as technology upgrades from MPEG2 to MPEG4.
• Projects like national ID cards, bank cards and kisan cards are likely to favor the semiconductor usage in emerging segment of smart cards.
• Low manufacturing index leads to opportunity loss of $3.37 billion semiconductor market revenues. This loss anticipated to increase to $4.35 billion by 2010.
• Immense, yet untapped, opportunities exist for semiconductors in STBs, LCD TVs, digital cameras and storage Flash memory markets.
• Decline in semiconductor product prices result in lower revenue realization; key semiconductor products impacted are memory, MCU and discrete. Increase in memory usage in a variety of products to offset revenue loss on accountof decline in prices.
• Increased usage of system-on-chip (SoC) leads to decline in the overall revenues. Though the decline is not proportionate to the reduction of components, the impact is significant.
• Higher penetration of notebooks to impact market for desktops and offline UPS
• Current slowdown to impact overall growth and manufacturing investment prospects for 2009; uncertainty in government decision-making adversely affects growth.
Some of the other forecasts of the report indicate that India will likely improve its share to 2.8 percent of the global semiconductor market by 2010. Also, the India market CAGR forecast is at 6.4 times the global market CAGR, over next two years !
Again, do not get carried away by these statistics!
Further, in an update to the 2007 forecast, the previous study had non-inclusion of select products segments such as digital cameras, power supplies, CFL, CCTV, PoS, Weighing Scale, etc., which have been now added. This update sees the entry of new players and an unprecedented expansion of the DTH market. Migration of select products manufacturing outside the country has also taken place.
The total TM and TAM revenue constituents (2008) are: TM revenues: $5,901.8 million; and TAM revenues: $2,531.8 million. Now, for the segment wise break-ups and segment drivers, respectively.
IT/OA semiconductor constituents (2008)
TM revenues: $2,503.4 million; TAM revenues: $1,161.3 million.
* Notebooks, desktops and servers were the key contributors to the MPU, memory and ASSP TM revenues.
* Desktops are key revenue generators for MPU TAM revenues.
* CAGR for IT/OA is TM at 13.5 percent and TAM at 7.4 percent for 2008-10.
* Key drivers for TM are government IT initiatives, low priced notebooks, netbooks and storage flash memory; while low priced desktops and LCD monitors are the drivers for TAM.
Wireless handsets semiconductor constituents (2008)
TM revenues: $1,738.3 million; TAM revenues: $791 million.
* DSP and ASSP to ride on growth of economically priced handsets in GSM and CDMA.
* Smartphones in GSM to drive growth of TM revenues for memory, DSP and ASSP.
* CAGR for wireless handsets is TM at 5.7 percent and TAM at 5.1 percent for 2008-10.
* Key drivers for TM and TAM include GSM handsets priced <$125 and between $125-250, as well as CDMA handsets priced $250 is the key driver.
Communications semiconductor constituents (2008)
TM revenues: $754 million; TAM Revenues: $153.9 million.
* WiMAX BTS is the driver for ASIC market.
* Infrastructure equipment like WiMAX and STM were the key factors behind analog power’s TM and TAM revenues.
* Logic/FPGA rode on the STM and BTS markets.
* Low manufacturing index conspicuous in this key segment.
* CAGR for communications is TM at 27.9 percent and TAM at 64.1 percent for 2008-10.
* Key drivers for TM and TAM include the rollout of 3G, WiMAX and penetration of broadband services. For TAM, BTS, STM and WiMAX are the major drivers.
Consumer semiconductor constituents (2008)
TM revenues: $432.9 million; TAM revenues: $165.6 million.
* ASSP market growth on account of penetration of LCD into CRT TVs, STBs and DVD players.
* Low manufacturing index indicates lost opportunity for semiconductor revenues.
* CAGR for consumer equipment is TM at 12.2 percent and TAM at 18.7 percent for 2008-10.
* Key drivers for TM include STBs, LCD TVs and digital cameras, while those for TAM include STBs, LCD TVs and water purifiers.
Industrial semiconductor constituents (2008)
TM revenues: $144.9 million; TAM revenues: $106.7 million.
* Energy meters, UPS and weighing scales are the contributors to the MCUs.
* Discrete and analog power are omnipresent products across applications.
* CAGR for industrial electronics segment is TM at 12.5 percent and TAM at 14.9 percent for the period 2008-10.
* Key drivers for TM include online UPS, CFL, energy meters and power supplies. Those for TAM include energy meters, CFL and power supplies.
Automotive semiconductor constituents (2008)
TM revenues: $76.5 million; TAM revenues: $50.8 million.
* The MCU market has high dependence on the EMS and body electronics markets
* The Nano car, statutory regulations on emission norms, and safety features are likely to sustain demand.
* CAGR for automotive electronics is TM at 23.1 percent and TAM a
t 24.8 percent.
* Key drivers include two-wheeler instrument clusters, EMS and immobilizers.
Other electronics semiconductor constituents (2008)
TM revenues: $251.7 million; TAM revenues: $102.5 million.
* Applications like smart cards, and aerospace and defence are driving the ASSP TM and TAM revenues, respectively.
* CAGR for this segment is TM at 16.8 percent and TAM at 23.8 percent.
* Smart cards and government space research programs are the key drivers.
